

The Butterfly Effect of Bad Data (Part 2)
Last time... Bad Data was revealed to be pervasive and costly In the first part of this two-part post, I wrote about the truly abysmal business outcomes our survey respondents reported in our "Poor Data Quality - Negative Business Outcomes" survey. Read about it here. In writing part 1, I was stunned by the following statistic: 95% of those suffering supply chain issues noted reduced or lost savings that might have been attained from better supply chain integration. The lost savings were large, with 15% reporting missed savings of up to 20%! In this post, I'll have a look at supply chains, and how passing bad data among participants harms participants and stakeholders, and how this can cause a "butterfly effect".
Supply Chains spread the social disease of bad data
A supply chain is a community of "consenting" organizations that pass data across and among themselves to facilitate business functions such as sales, purchase ordering, inventory management, order fulfillment, and the like. The intention is that executing these business functions properly will benefit the end consumer, and all the supply chain participants.In case the Human Social Disease Analogy is not clear...
Human social diseases spread like wildfire among communities of consenting participants. In my college days, the news that someone contracted a social disease was met with chuckles, winks, and a trip to the infirmary for a shot of penicillin. Once, a business analogy to those long-past days might have been learning that the 9-track tape you sent to a business partner had the wrong blocking factor, was encoded in ASCII instead of EBCDIC, or contained yesterday's transactions instead of today's. All of those problems were easily fixed. Just like getting a shot of penicillin. Today, we live in a different world. As we learned with AIDS, a social disease can have pervasive and devastating results for individuals and society. With a communicable disease, the inoculant has its "bad data" encoded in DNA. Where supply chains are concerned, the social disease inoculant is likely to be an XML-encoded transaction sent from one supply chain participant to another. In this case, the "bad transaction" information about the customer, product, quantity, price, terms, due date, or other critical information will simply be wrong, causing a ripple of negative consequences across the supply chain. That ripple is the Butterfly Effect.The BUTTERFLY EFFECT
The basis of the Butterfly Effect is that a small, apparently random input to an interconnected system (like a supply chain) may have a ripple effect, the ultimate impact of which cannot be reasonably anticipated. As the phrase was constructed by Philip Merilees in back in 1972...Does the flap of a butterfly’s wings in Brazil set off a tornado in Texas?According to Martin Christopher, in his 2005 E-Book "Logistics and Supply Chain Management", the butterfly can and will upset the supply chain.
Today's supply chains are underpinned by the exchange of information between all the entities and levels that comprise the complete end-to-end [supply chain] network... The so-called "Bullwhip" effect is the manifestation of the way that demand signals can be considerably distorted as a result of multiple steps in the chain. As a result of this distortion, the data that is used as input to planning and forecasting activities can be flawed and hence forecast accuracy is reduced and more costs are incurred. (Emphasis provided)
Supply Chains Have Learned that Bad Data is a Social Disease
Supply chains connect a network of organizations that collaborate to create and distribute a product to its consumers. Specifically, Investopedia defines a supply chain as:The network created amongst different companies producing, handling and/or distributing a specific product. Specifically, the supply chain encompasses the steps it takes to get a good or service from the supplier to the customerManaging the supply chain involves exchanges of data among participants. It is easy to see that exchanging bad data would disrupt the chain, adding cost, delay, and risk of ultimate delivery failure to the supply chain mix. With sufficient bad data, the value delivered by a managed supply chain would come at a higher cost and risk. Consider the graphic of supply chain management and the problems our survey respondents found in their experiences with supply chains and bad data. Click on the graphics to see them in full size.
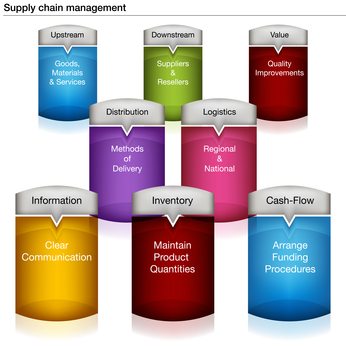
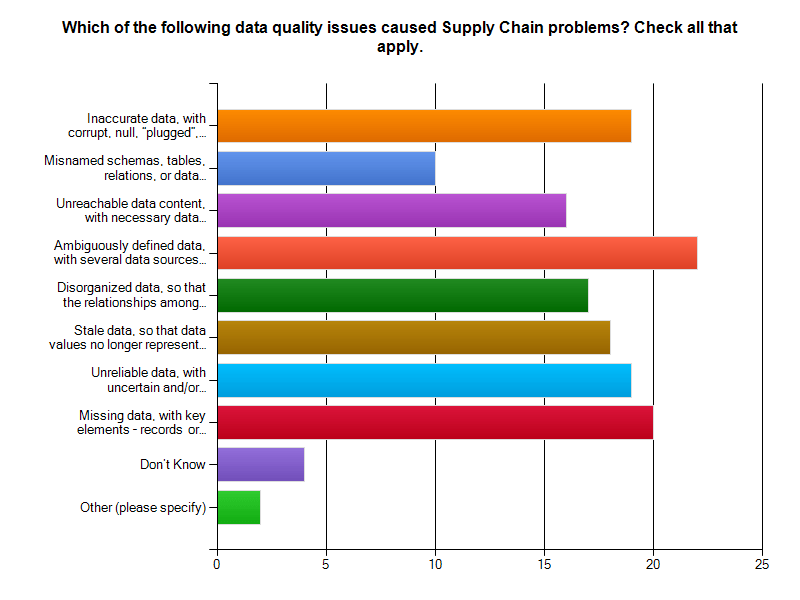
Bad data means ambiguously defined data, missing data, and inaccurate data with corrupt or plugged values. These issues lead the list of supply chain data problems found by our survey respondents.
Would you be pleased to purchase a new car delivered with parts that do not work or break because suppliers misinterpreted part specifications? Do you remember the old 1960 era Fords whose doors let snow inside because of their poor fit? Let's not pillory Ford, as GM and Chrysler had their own quality meltdowns too. Supply chain-derived quality issues like these kill revenues and harm consumers and brands.
Would you like to drive the automobile that contained safety components ordered with missing and corrupt data? What about that artificial knee replacement you were considering? Suppose the specifications for your medical device implant had been ambiguously defined and then misinterpreted. Ready to go ahead with that surgery? Bad data is a social disease, and it could make you suffer!
Bad Data is an Expensive Supply Chain Social Disease
Bad data is costing supply chain participants big money. As the graphic from our survey indicates, more than 20% of respondents to the Supply Chain survey segment thought that data quality problems added between 6% and 10 %. to the cost of operating their supply chain. Almost 16% said data quality problems added between 11% and 20% to supply chain operating costs. That is HUGE! The graphic following gives you survey results. Notice that 44% of the respondents could not monetize their supply chain data problems. That is a serious finding, in and of itself.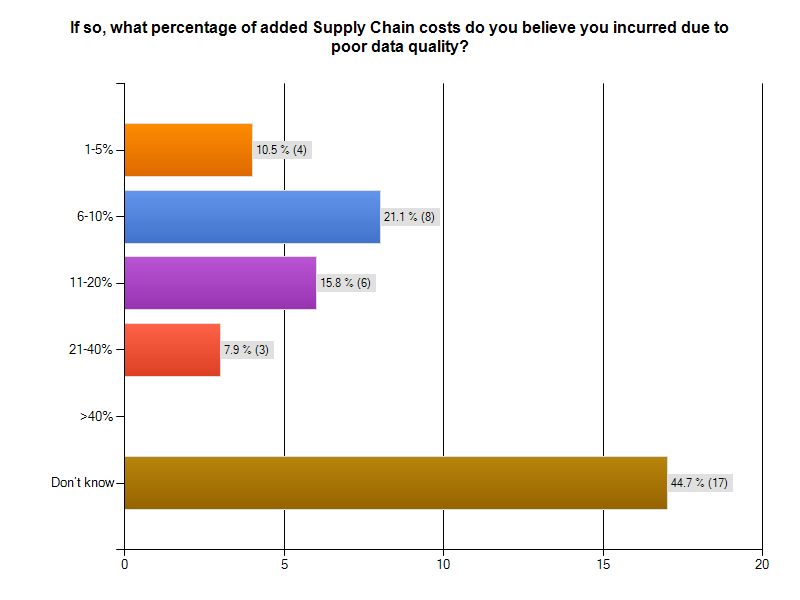
THOUGHT EXPERIMENT: CUT SUPPLY CHAIN MANAGEMENT COSTS by 20%
Over 15% of survey respondents with supply chain issues believed bad data added between 11% and 20% to the cost of operating their supply chain.Let's use 20% in our thought experiment, to yield a nice round number.
Understanding the total cost of managing a supply chain is a non-trivial exercise. Industry body The Supply Chain Council has defined The Supply Chain Operations Reference (SCOR®) model. According to that reference model, Supply Chain Management Costs include the costs to plan, source, and deliver products and services. The costs of making products and handling returns are captured in other aggregations.
For a manufacturing firm with a billion dollar revenue stream, the total costs of managing a supply chain will be around 20% of revenue, or $200,000,000 USD. Reducing this cost by 20% would mean an annual saving $40,000,000 USD. That would be a significant savings, for a data cleanup and quality sustenance investment of perhaps $3,000,000. The clean-up investment would be a one-time expense. If the $40,000,000 were a one time savings, the ROI would be 1,3333%.
But wait, it is better than that. The $40,000,000 savings recurs annually. The payback period is measured in months. The ROI is enormous. Having clean data pays big dividends!
If you think the one-time "get it right and keep it right" investment would be more like $10,000,000 USD, your payback period would still be measured in months, not years. Let's add a 20% additional cost or $2,000,000 USD in years 2-5 for maintenance and additional quality work. That means you would have spent $18,000,000 USD in 5 years to achieve a savings $200,000,000. That would be greater than a 10-times return on your money! Not too shabby an investment, and your partners and stakeholders would be saving money too. This scenario is really a win-win situation, right down the line to your customers.
The Corcardia Group believes that total supply chain costs for hospitals approach 50% of the hospital's operating budget. For a hospital with a $60,000,000 USD annual operating budget, a 20% savings means $12,000,000 USD would be freed for other uses, like curing patients and preventing illness.
Even Better...
For manufacturers, hospitals, and other supply chain participants, ridding themselves of bad data will produce still better returns. By cleaning up the data throughout the supply chain, it is likely that costs would go down while margins would improve. The product costs for participants could drop. Firms might realize an additional 5% cost savings from this as well. Their return is even better.What does the Supply Chain Community say about Data Quality?
A 2011 McKinsey & Company study entitled McKinsey on Supply Chain: Selected Publications, which you can download here, the publication "The Challenges Ahead for Supply Chains" by Trish Gyorey, Matt Jochim, and Sabina Norton goes right to the heart of a supply chain's dependency on data, and the weakness of current supply chain decision-making based on that data. According to the authors:Knowledge is power The results show a similar disconnection between data and decision making: companies seem to collect and use much less detailed information than our experience suggests is prudent in making astute supply chain decisions (Exhibit 6). For example, customer service is becoming a higher priority,and executives say their companies balance service and cost to serve effectively... Half of the executives say their companies have limited or no quantitative information about incremental costs for raw materials, manufacturing capacity, and personnel, and 41 percent do not track per-customer supply chain costs at any useful level of detail.Here is Exhibit 6 - a graphic from their study, referenced in the previous quote.
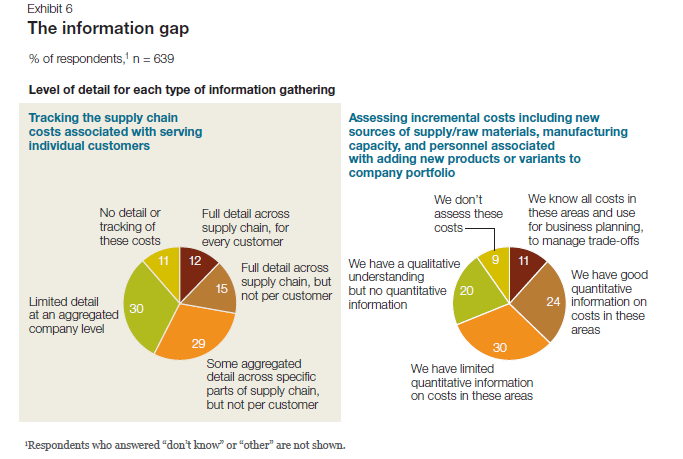
- McKinsey & Company Challenges Ahead for Supply Chains - Exhibit 6
... there is a growing emphasis among many organizations on knowing their customers' needs. More than this, organizations are seeking to influence the behavior of customers and prospects, guiding customers' purchasing decisions toward their own products and services and away from those of competitors. This change in focus is leading to a greater demand for and reliance on consistent data.White's take-away from this is...
...as companies' growing focus on collaboration with trading partners and their need to improve business outcomes, data consistency—especially between trading partners—is increasingly a prerequisite for improved and competitive supply chain performance. As data quality and consistency become increasingly important factors in supply chain performance, companies that want to catch up with the innovators will have to pay closer attention to master data management. That may require supply chain managers to change the way they think about and utilize data.Did everyone get that? Data Quality and Consistency are important factors in supply chain performance. You want your auto and your artificial knee joint to work properly and consistently, as their designers and builders intended. This means curing existing data social disease victims and preventing the recurrence and spread.
The Bottom Line
At this point, nearly 300 respondents have begun their surveys, and more than 200 have completed them. I urge those who have left their surveys in mid-course to complete them!Bad data is a social disease that harms supply chain participants and stakeholders. Do take a stand on wiping it out. The simplest first step is to make your experiences known to us by visiting the IBM InfoGovernance site and taking our "Poor Data Quality - Negative Business Outcomes" survey.
When you get to the question about participating in an interview, answer "YES"and give us real examples of problems, solutions attempted, success attained, and failures sustained. Only by publicizing the magnitude and pervasiveness of this social disease will we collectively stand a chance of achieving cure and prevention.
As a follow-up next step, work with us to survey your organization in a private study that parallels our public InfoGovernance study. The public study forms a excellent baseline for us to compare and contrast the specific data quality issues within your organization. Data Quality will not be attained and sustained until your management understands the depth and breadth of the problem and its cost to your organization's bottom line.
Contact me here and let us help you build the business case for eliminating the causes of bad data. Published by permission of Stuart Selip, Principal Consulting LLC
As the consulting industry changes will you be the disrupter, not the disrupted?
Will you be the disrupter, not the disrupted? This is the question that came to mind as I read Consulting on the Cusp of Disruption, by Clayton M. Christensen, Dina Wang, and Derek van Bever, in the October 2013 issue of the Harvard Business Review (HBR). With an online subscription, you can read it here. Disruption means industry leaders are responding to the changes in customer demands and global economics by making fundamental changes in their approach to services, service delivery, engagement models, and the economic model on which their industry is based.  As an example of disruption, the HBR authors open by discussing the McKinsey & Company move to develop McKinsey Solutions, an offering that is not "human-capital based", but instead focuses on technology and analytics embedded at their client. This is a significant departure for a firm known for hiring the best and the brightest, to be tasked with delivering key insights and judgement. Especially when the judgment business was doing well. The authors make the point that the consulting industry has evolved over time.
Generalists have become Functional Specialists Local Structures developed into Global Structures Tightly Structured Teams morphed into spider webs of Remote Specialists
 However, McKinsey Solutions was not evolutionary. In its way, it was a revolutionary breakthrough for McKinsey. While McKinsey Solutions' success meant additional revenue for the firm, and offered another means of remaining "Top of Mind" for the McKinsey Solutions' client, the move was really a first line of defense against disruption in the consulting industry. By enjoying "first mover advantage" McKinsey protected their already strong market position, and became the disrupter, not the disrupted.
What is the classic pattern of disruption?
According to Christensen, et al,New competitors with new business models arrive; incumbents choose to ignore the new players or flee to higher-margin activities; a disrupter whose product was once barely good enough achieves a level of quality acceptable to the broad middle of the market, undermining the position of longtime leaders and often causing the "flip" to a new basis of competition.Cal Braunstein, CEO of The Robert Frances Group, believes that IT needs a disruptive agenda. In his research note, Cal references the US auto industry back in the happy days when the Model "T" completely disrupted non-production line operations of competitors. But when disruption results in a workable model with entrenched incumbents, the market once again becomes ripe for disruption. That is exactly what happened to the "Big 3" US automakers when Honda and Toyota entered the US market with better quality and service at a dramatically lower price point. Disruption struck again. Detroit never recovered. The City of Detroit itself is now bankrupt. Disruption has significant consequences.
Industry leaders may suffer most from disruption
In his work "The Innovator's Solution" HBR author Clayton M. Christensen addressed the problem of incumbents becoming vulnerable to disruption, writingThe disruption problem is worse for market leaders, according to Christensen.An organization's capabilities become its disabilities when disruption is afoot.
No challenge is more difficult for a market leader facing disruption than to turn and fight back - to disrupt itself before a competitor does... Success in self-disruption requires at least the following six elements: An autonomous business unit... Leaders who come from relevant "schools of experience"... A separate resource allocation process... Independent sales channels... A new profit model... Unwavering commitment by the CEO...So, it will be tough to disrupt yourself if you are big, set in your ways, and don't have the right CEO.
Being the disrupter, not the disrupted
The HBR authors characterized three forms of offering consulting, ranging from the traditional "Solution Shop" to "Value-added Process Businesses" and then to "Facilitated Networks". The spectrum ranges from delivering pronouncements from gifted but opaque expert practitioners charging by the hour through repeatable process delivery charging for delivered results to dynamic and configurable collections of experts linked by a business network layer. In my experience, the expert network form is the most flexible, least constrained, and most likely to deliver value at an exceptional price. It is at once the most disruptive, and presently the least likely form to be destabilized by other disruptive initiatives.The Bottom Line
 If you are in the consulting industry and you don't recognize that disruptive forces are changing the industry and your market's expectations as you read this, you will surely be the disrupted, not the disrupter. On the other hand, disrupters can be expected to provide a consulting service that will deliver much more value for a much lower price point. We are talking here of more than a simple process improvement 10% gain. It will be a quantum jump. Like McKinsey, that may come from embedding in some new solution that accelerates the consulting process and cuts costs. Now is the time to develop situation awareness. What are the small independent competitors doing? Yes, the little firms that you don't really think will invade your market and displace you. Watch them carefully, and learn before it is too late. Those readers who man those small, agile, and disruptive firms should ensure they understand their prospect's pain points and dissatisfaction with the status quo. As physician Sir William Olser famously said "Listen to your patient, he is telling you his diagnosis". Do it now! >
-
If you are in the consulting industry and you don't recognize that disruptive forces are changing the industry and your market's expectations as you read this, you will surely be the disrupted, not the disrupter. On the other hand, disrupters can be expected to provide a consulting service that will deliver much more value for a much lower price point. We are talking here of more than a simple process improvement 10% gain. It will be a quantum jump. Like McKinsey, that may come from embedding in some new solution that accelerates the consulting process and cuts costs. Now is the time to develop situation awareness. What are the small independent competitors doing? Yes, the little firms that you don't really think will invade your market and displace you. Watch them carefully, and learn before it is too late. Those readers who man those small, agile, and disruptive firms should ensure they understand their prospect's pain points and dissatisfaction with the status quo. As physician Sir William Olser famously said "Listen to your patient, he is telling you his diagnosis". Do it now! >
-Decision-Making Bias – What, Me Worry?
RFG POV: The results of decision-making bias can come back to bite you. Decision-making bias exists and is challenging to eliminate! In my last post, I discussed the thesis put forward by Nobel Laureate Daniel Kahneman and co-authors Dan Lovallo, and Olivier Sibony in their June 2011 Harvard Business Review (HBR) article entitled "Before You Make That Big Decision…". With the right HBR subscription you can read the original article here. Executives must find and neutralize decision-making bias.
The authors discuss the impossibility of identifying and eliminating decision-making bias in ourselves, but leave open the door to finding decision-making bias in our processes and in our organization. Even better, beyond detecting bias you may be able to compensate for it and make sounder decisions as a result. Kahneman and his McKinsey and Co. co-authors state:
We may not be able to control our own intuition, but we can apply rational thought to detect others' faulty intuition and improve their judgment.
Take a systematic approach to decision-making bias detection and correction
The authors suggest a systematic approach to detecting decision-making bias. They distill their thinking into a dozen rules to apply when taking important decisions based on recommendations of others. The authors are not alone in their thinking!
In an earlier post on critical thinking, I mentioned the Baloney Detection Kit. You can find the "Baloney Detection Kit" for grown-ups from the Richard Dawkins Foundation for Reason and Science and Skeptic Magazine editor Dr. Michael Shermer on the Brainpickings.org website, along with a great video on the subject.
Decision-making Bias Detection and Baloney Detection
How similar are Decision-bias Detection and Baloney Detection? You can judge for yourself by looking at the table following. I’ve put each list in the order that it was originally presented, and made no attempt to cross-reference the entries. Yet it is easy to see the common threads of skepticism and inquiry. It is all about asking good questions, and anticipating familiar patterns of biased thought. Of course, basing the analysis on good quality data is critical!
Decision-Bias Detection and Baloney Detection Side by Side
|
Decision-Bias Detection
|
Baloney Detection
|
|---|---|
| Is there any reason to suspect errors driven by your team's self-interest? | How reliable is the source of the claim |
| Have the people making the decision fallen in love with it? | Does the source of the claim make similar claims? |
| Were there any dissenting opinions on the team? | Have the claims been verified by someone else (other than the claimant?) |
| Could the diagnosis of the situation be overly influenced by salient analogies? | Does this claim fit with the way the world works? |
| Have credible alternatives been considered? | Has anyone tried to disprove the claim? |
| If you had to make this decision again in a year, what information would you want, and can you get more of it now? | Where does the preponderance of the evidence point? |
| Do you know where the numbers came from | Is the claimant playing by the rules of science? |
| Can you see the "Halo" effect? (the story seems simpler and more emotional than it really is." | Is the claimant providing positive evidence? |
| Are the people making the recommendation overly attached to past decisions? | Does the new theory account for as many phenomena as the old theory? |
| Is the base case overly optimistic? | Are personal beliefs driving the claim? |
| Is the worst case bad enough? | ---------------------------- |
| Is the recommending team overly cautious? | ---------------------------- |
Conclusion
While I have blogged about the negative business outcomes due to poor data quality, good quality data alone will not save you from the decision-making bias of your recommendations team. When good-quality data is miss-applied or miss-interpreted, absent from the decision-making process, or ignored due to personal "gut" feelings, decision-making bias is right there, ready to bite you Stay alert, and stay skeptical!
reprinted by permission of Stu Selip, Principal Consulting LLC
Blog: Green Data Centers an Oxymoron
Lead Analyst: Cal Braunstein
The New York Times published "Power, Pollution and the Internet," an article on the dark side of data centers. The report, which was the result of a yearlong investigation, highlights the facts related to the environmental waste and inefficiencies that can be found in the vast majority of data centers around the world. RFG does not contest the facts as presented in the article but the Times failed to fully recognize all the causes that led to today's environment and the use of poor processes and practices. Therefore, it can only be partially fixed – cloud computing notwithstanding – until there is a true transformation in culture and mindset.
New York Times Article
The New York Times enumerated the following energy-related facts about data centers:
- Most data centers, by design, consume vast amounts of energy
- Online companies run their facilities 24x7 at maximum capacity regardless of demand
- Data centers waste 90 percent or more of the electricity they consume
- Worldwide digital warehouses use about 30 billion watts of energy; U.S. accounts for 25 to 33 percent of the load
- McKinsey & Company found servers use only six to 12 percent of their power consumption on real work, on average; the rest of the time the servers are idle or in standby mode
- International Data Corp. (IDC) estimates there are now more than three million data centers of varying sizes worldwide
- U.S. data centers use about 76 billion kWh in 2010, or roughly two percent of all electricity used in the country that year, according to a study by Jonathan G. Koomey.
- A study by Viridity Software Inc. found in one case where of 333 servers monitored, more than half were "comatose" – i.e., plugged in, using energy, but doing little if any work. Overall, the company found nearly 75 percent of all servers sampled had a utilization of less than 10 percent.
- IT's low utilization "original sin" was the result of relying on software operating systems that crashed too much. Therefore, each system seldom ran more than one application and was always left on.
- McKinsey's 2012 study currently finds servers run at six to 12 percent utilization, only slightly better than the 2008 results. Gartner Group also finds the typical utilization rates to be in the seven to 12 percent range.
- In a typical data center when all power losses are included – infrastructure and IT systems – and combined with the low utilization rates, the energy wasted can be as much as 30 times the amount of electricity used for data processing.
- In contrast the National Energy Research Scientific Computing Center (NERSCC), which uses server clusters and mainframes at the Lawrence Berkeley National Laboratory (LBNL), ran at 96.4 percent utilization in July.
- Data centers must have spare capacity and backup so that they can handle traffic surges and provide high levels of availability. IT staff get bonuses for 99.999 percent availability, not for savings on the electric bill, according to an official at the Electric Power Research Institute.
- In the Virginia area data centers now consume 500 million watts of electricity and projections are that this will grow to one billion over the next five years.
- Some believe the use of clouds and virtualization may be a solution to this problem; however, other experts disagree.
Facts, Trends and Missed Opportunities
There are two headliners in the article that are buried deep within the text. The "original sin" was not relying on buggy software as stated. The issue is much deeper than that and it was a critical inflection point. And to prove the point the author states the NERSCC obtains utilization rates of 96.4 percent in July with mainframes and server clusters. Hence, the real story is that mainframes are a more energy efficient solution and the default option of putting workloads on distributed servers is not a best practice from a sustainability perspective.
In the 1990s the client server providers and their supporters convinced business and IT executives that the mainframe was dead and that the better solution was the client server generation of distributed processing. The theory was that hardware is cheap but people costs are expensive and therefore, the development productivity gains outweighed the operational flaws within the distributed environment. The mantra was unrelenting over the decade of the 90s and the myth took hold. Over time the story evolved to include the current x86-architected server environment and its operating systems. But now it is turning out that the theory – never verified factually – is falling apart and the quick reference to the 96.4 percent utilization achieved by using mainframes and clusters exposes the myth.
Let's take the key NY Times talking points individually.
- Data centers do and will consume vast amounts of energy but the curve is bending downward
- Companies are beginning to learn to not run their facilities at less than maximum capacity. This change is relatively new and there is a long way to go.
- Newer technologies – hardware, software and cloud – will enable data centers to reduce waste to less than 20 percent. The average data center today more than half of their power consumption on non-IT infrastructure. This can be reduced drastically. Moreover, as the NERSCC shows, it is possible to drive utilization to greater than 90 percent.
- The multiple data points that found the average server utilization to be in the six to 12 percent range demonstrated the poor utilization enterprises are getting from Unix and Intel servers. Where virtualization has been employed, the utilization rates are up but they still remain less than 30 percent on average. On the other hand, mainframes tend to operate at the 80 to 100 percent utilization level. Moreover, mainframes allow for shared data whereas distributed systems utilize a shared-nothing data model. This means more copies of data on more storage devices which means more energy consumption and inefficient processes.
- Comatose servers are a distributed processing phenomenon, mostly with Intel servers. Asset management of the huge server farms created by the use of low-cost, single application, scale-out hardware is problematic. The complexity caused by the need for orchestration of the farms has hindered management from effectively managing the data center complex. New tools are constantly coming on board but change is occurring faster than the tools can be applied. As long as massive single-application server farms exist, the problem will remain.
- Power losses can be reduced from 30 times that used to less than 1.5 times.
- The NERSCC utilization achievement would not be possible without mainframes.
- Over the next five years enterprises will learn how to reduce the spare capacity and backup capabilities of their data centers and rely upon cloud services to handle traffic surges and some of their backup/disaster recovery needs.
- Most data center staffs are not measured on power usage as most shops do not allocate those costs to the IT budget. Energy consumption is usually charged to facilities departments.
- If many of the above steps occur, plus use of other processes such as the lease-refresh-scale-up delivery model (vs the buy-hold-scale-out model) and the standardized operations platform model (vs development selected platform model), then the energy growth curve will be greatly abated, and could potentially end up using less power over time.
|
Operations standard platforms (cloud) |
Greater standardization and reduced platform sprawl but more underutilized systems |
Least cost |
|
Development selected platforms |
Most expensive
|
Greater technical currency with platform islands and sprawl |
|
Model philosophies
|
Buy-hold-scale-out
|
Lease-refresh-scale-up
|
- Clouds and virtualization will be one solution to the problem but more is needed, as discussed above.
RFG POV: The mainframe myths have persisted too long and have led to greater complexity, higher data center costs, inefficiencies, and sub-optimization. RFG studies have found that had enterprises kept their data on the mainframe while applications were shifted to other platforms, companies would be far better off than they are today. Savings of up to 50 percent are possible. With future environments evolving to processing and storage nodes connected over multiple networks, it is logical to use zEnterprise solutions to simplify the data environment. IT executives should consider mainframe-architected solutions as one of their targeted environments as well as an approach to private clouds. Moreover, IT executives should discuss the shift to a lease-refresh-scale-up approach with their financial peers to see if and how it might work in their shops.